
Let’s dive into the benefits and importance of visual project management tools, which enhance productivity and collaboration.
Discover how visualizing tasks and timelines improves communication, streamlines workflows, and ultimately drives project success.
Download a free trial of MindManager® today to explore our visual project management tools.
What is visual project management?
Visual project management is a way to plan, organize, and follow projects using pictures and tools. It shows project tasks, timelines, and progress using charts, graphs, diagrams, and Kanban boards.
The main use of visual project management is to make project communication and collaboration better.
Using imagery, team members can easily understand what the project is about, its goals, and timelines. Visual project management also helps identify dependencies, bottlenecks, and potential risks.
Here are some ways visuals help with project management:
- Planning and organizing. Tools like Gantt charts show project tasks and timelines in a clear way, helping with planning and organizing.
- Tracking progress. Teams can see how tasks are going and when important things are happening using pictures. This makes it easy to make decisions and solve problems quickly.
- Identifying bottlenecks. Kanban boards show where there are problems and delays in the project. This helps teams fix issues and make the project work better.
- Managing resources. Visuals help show how resources are used, so managers can use them better and give tasks to the right team members.
- Presenting information. Updates and reports about the project can be shown in diagrams, making it easy to understand how the project is going.
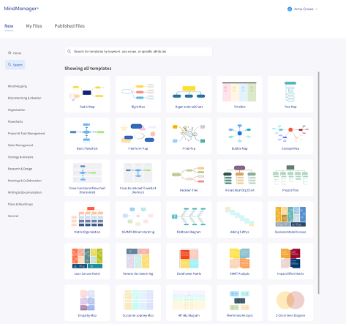
How to create a visual project map with MindManager
Making a visual project map is made easy with MindManager. If you have a project or task at hand, then you’re ready to get started.
- First, sign in to your MindManager account. Don’t have an account? Get your free trial here!

- Choose from one of the MindManager templates. For this example, we are choosing the timeline chart template.
- Fill out your timeline chart with your tasks. Take a look at the year ahead and start to fill in tasks month-by-month and throughout Q1 through Q4.
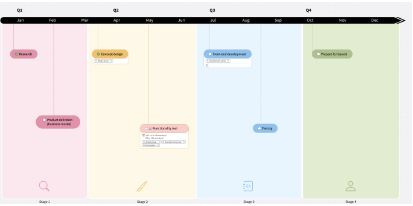
- Get detailed. Add detailed tasks to each original task. You can tag coworkers or employees to assign specific responsibilities.
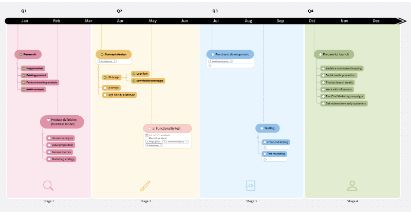
- Add images, colors, and fonts. Use design tools to show statuses, assignees, due dates, and notes within different project steps.
Timeline charts are meant to grow as your project or year progresses.
For that reason, you never have to “complete” your chart. You can keep adding tasks and goals when you have additional ideas or as the year progresses.
In the end, you’ll have a large, big picture of your team’s deadlines, located where everyone can see it.
Why is visualization important in project management?
Visualization is important in project management because it allows project managers to show difficult information in a clear manner. It helps to break down large amounts of data and present it in a visually pleasing format, making it easier for stakeholders and team members alike to understand and make better choices.
Visualization also helps in identifying patterns, trends, and possible issues in a project. This allows teams to adjust the process where needed.
At its core, visualization improves collaboration and engagement among team members, fostering a shared understanding and alignment toward project goals.
5 benefits of visual project management
Implementing a visual project management system can benefit businesses that are interested in simplifying their processes and improving project outcomes.
Here are five benefits businesses, individuals, and teams can gain from implementing visual project management tools.
1. Improved communication and collaboration
Visual project management tools provide a clear and visual representation of project progress, deadlines, and tasks, making it easier for team members to understand project status at a glance. This leads to improved communication and collaboration among team members, reducing misunderstandings and increasing productivity.
2. Increased efficiency and productivity
Visual project management allows teams to track and manage their tasks better, helping them use resources effectively. For example, the Project Management Institute (PMI) found that businesses with solid project planning practices have a 71% project success rate.
Using visual timelines and charts, teams can quickly identify issues, prepare for potential delays, and make changes to ensure project delivery is on time.
3. Enhanced stakeholder engagement and transparency
Visual project management gives stakeholders a solid overview of project status, progress, and wins. This builds trust and confidence with stakeholders, leading to better engagement.
4. Improved decision-making and risk management
A study conducted in 2023 shows that information visualization can help improve decision quality and speed. Visual project management tools give project teams a whole view of project data, helping them make educated decisions and manage risks.
By visualizing project dependencies, critical paths, and possible issues, teams can address issues and reduce risks before they impact the project.
5. Enhanced accountability and performance tracking
Visual project management makes tracking individual and team progress easier, leading to higher accountability among team members. By visualizing key performance indicators, such as task completion rates and resource utilization, teams can identify areas for improvement and take necessary actions to better project performance.
The 6 best visual project management software tools
With so many visual project management software tools on the market, it may be hard to decide which will work best for you. Below are the five most popular and useful tools to help you and your team manage your projects.
1. MindManager
MindManager is a comprehensive visual project management software tool that allows users to create, organize, and share visual representations of their projects. It offers mind mapping, task management, real-time collaboration in an easy way, adding resources, working with SmartRules, track progress, add priorities, easy sharing, linking, integration with other business tools, and so much more.
2. Basecamp
Basecamp is a popular visual project management software tool that provides a centralized platform for teams to collaborate on projects. It offers various features including task management, file sharing, team messaging, and project tracking, all displayed in a visually organized interface.
With Basecamp, users can easily visualize the progress of projects, allocate tasks, and communicate effectively with team members, enhancing overall project management efficiency.
3. Monday.com
Monday.com is a popular visual project management software tool that provides a visually appealing and intuitive interface for managing projects. Monday.com provides users with customizable dashboards, timeline views, task tracking, and collaboration tools to simplify and streamline project management processes.
4. Kissflow Project
Kissflow Project is a visual project management software tool that streamlines project workflows and improves team collaboration. It features Kanban boards, Gantt charts, collaboration tools, and automated notifications to help teams stay organized and enhance project visibility.
5. Asana
Asana is a visual project management software tool that allows teams to manage their projects and tasks in a visually appealing and structured manner. The platform offers capabilities, such as task dependencies, timeline views, progress tracking, and integrations with other popular business tools for seamless project management.
6. Wrike
Wrike is a powerful visual project management software tool that offers a visual and collaborative workspace for teams to manage their projects efficiently. It allows users to utilize features like Gantt charts, task prioritization, resource management, real-time collaboration, and reporting capabilities to ensure project success and collaboration across teams and departments.
Examples of visual project management
Visual project management tools are used in many scenarios and businesses to improve projects.
Below are two real-life examples where visual project management tools could be used and how they may benefit the users.
Example 1: A marketing agency using Kanban boards
Scenario: A marketing agency is in charge of working on multiple client projects at the same time. They need a visual project management tool to organize and track the progress of these projects.
Solution: The agency can utilize Kanban boards to manage their projects. They can create separate boards for each client’s project and divide them into different columns such as “To Do,” “In Progress,” and “Completed.”
Each task or deliverable can then be represented as a card on the board, easily moving between columns as progress is made.
Benefits: The agency can easily visualize the workflow and identify project issues or delays. They can track the tasks that are in progress, those that need attention, and those that have been completed.
Kanban boards also promote collaboration and communication among team members by offering a clear overview of the status of different projects.
Example 2: A software development company using Gantt charts (h3)
Scenario: A software development company is working on a complex project with multiple tasks and dependencies. They need a visual project management tool to schedule and monitor progress.
Solution: The company can utilize Gantt charts to manage its project. They can create a Gantt chart that acts as the timeline of the entire project, with tasks represented as bars along the timeline. Tasks can be linked to show their dependencies, and resources can be given to each task.
Benefits: The Gantt chart allows the company to visualize the project schedule, identify critical paths, and manage resources. They can see the interdependencies between tasks and adjust the schedule if necessary.
The chart also enables users to track progress, set goals, and communicate project status to stakeholders. Gantt charts provide a complete overview of the project and help keep it on track.
In both examples, visual project management provides a clear and organized overview of the project, making it easier for project managers and team members to collaborate, communicate, and make informed decisions about resource allocation and task prioritization.
5 visual project management tools
Looking for visual project management tools to streamline your projects? Look no further!
In this section, we explore five top-notch visual project management tools that can help you easily achieve your project goals.
1. Gantt charts
Gantt charts are visual project management tools that represent the project schedule on a horizontal timeline, with tasks plotted against time. They are widely used for planning, scheduling, and tracking projects.
Gantt charts provide a clear visual representation of the project, allowing project managers to easily track progress, identify delays, and make necessary changes.
Gantt charts are helpful when working on complex projects with many tasks and dependencies. However, they may not be suitable for small, simple projects with fewer tasks. This is because the level of detail included in Gantt charts can be too much in such cases.
2. Kanban boards
Kanban boards are visual tools that use columns and cards to represent different stages of a project or process. They clearly represent work in progress, allowing teams to easily track and manage tasks.
Kanban boards are highly flexible and can be used in various industries and projects, from software development to marketing campaigns. They promote transparency, collaboration, and continuous improvement.
Kanban boards are suitable for projects with changing priorities, as they allow teams to easily reorganize tasks and adjust the workflow. On the flip side, Kanban boards may not be suitable for projects with strict deadlines or requiring complex task dependencies and detailed scheduling.
3. Scrum boards
Scrum boards are visual tools used in agile project management, a flexible way of doing projects that focuses on teamwork, adaptability, and making small improvements step by step, represented in “sprints”. They visually represent the project backlog, sprint backlog, and current sprint progress.
Scrum boards use columns and cards to track tasks, prioritize work, and identify issues. They promote collaboration, quick decision-making, and flexible planning.
Scrum boards work well for projects that require frequent iterations, flexibility, and collaboration, such as software development. However, like Kanban boards and Gantt charts, they may not be great for projects with fixed deadlines, detailed scheduling, and strict task dependencies
4. Project timelines
Project timelines are visual representations of a project schedule in a linear format. They show the start and end dates of tasks and milestones. In addition, project timelines help set realistic deadlines, track progress, and communicate project timelines to stakeholders.
These visual tools are suitable for projects requiring a clear project schedule overview. On the other hand, project timelines may not be good for projects with complicated dependencies. It also many not work well for projects that have many schedule changes because it may be hard to update and maintain.
5. Project charters
Project charters outline the objectives, scope, stakeholders, deliverables, and timelines.
While not a traditional visual tool, project charters can be visualized using diagrams or infographics to enhance understanding and communication. Moreover, project charters help clarify the project’s purpose, aligning stakeholders, and providing a clear roadmap for completing the project.
Charters can benefit all types of projects, from small to large. But, while project charters can be very useful, they may not be the best for projects with a fast-paced environment or that require lots of changes. Instead, they are more suitable for projects with a defined goal.
6. Project status dashboards
Project status dashboards are visual tools that provide a real-time look at the project’s progress, performance, and data. They display key project metrics, such as task success rates, milestone wins, and budget status.
Project status dashboards help track project health, identify risks, and aid in stakeholder communication.
These tools are good for projects of any size and complexity. However, project status dashboards may not be the best for projects with limited resources or projects without real-time monitoring.
How MindManager facilitates visual project management
MindManager® is a helpful tool for managing projects visually. It lets you organize, plan, and track project details in one place using customizable maps. You can easily add notes, attachments, and links to access project information.
In MindManager, users can create Gantt charts, Kanban boards, timelines, and more to manage schedules and deadlines. It supports real-time collaboration among team members and integrates with products like Jira and Microsoft Teams for seamless workflow.
Overall, MindManager makes project management visual, intuitive, and efficient.
Embrace the power of visual communication and collaborative planning with MindManager. Download your free trial of MindManager to take advantage of visual project management templates and much more!